
2026 · Conference presentation · Extended abstract
Making the Invisible Visible: Sleep-Period Indoor Air Quality in Guestrooms of a Five-Star Conference Hotel
Background and objective
Restorative sleep is central to the hotel experience, yet hospitality management research often emphasizes perceptible attributes—bedding, noise, lighting, and thermal comfort—rather than the invisible air guests breathe overnight, which has been shown to influence sleep quality (Mao et al., 2018; Robbins et al., 2021). Among indoor air quality parameters, bedroom carbon dioxide (CO₂) serves as an indicator of outdoor-air ventilation and the accumulation of occupants’ exhaled breath, and elevated concentrations have been associated with poorer sleep quality. For example, empirical research reported an estimated 4.3% reduction in deep-sleep percentage for every 100 ppm increase in overnight mean CO₂ concentration (Xiong et al., 2020). Based on a comprehensive review of bedroom ventilation and sleep research, Akimoto et al. (2025) recommend maintaining sleep-period CO₂ below 1,000 ppm and preferably at or below 800 ppm to minimize the risk of sleep disturbance. Similarly, Lin et al. (2026) associated greater bedroom PM₂.5 exposure with a smaller proportion of deep sleep and poorer next-day endurance performance. Motivated by this evidence, the present study investigated how objectively measured sleep-period indoor air quality (IAQ) varied across guestrooms and occupancy levels in a five-star hotel hosting a four-day international academic conference in Chiang Mai, Thailand.
Field methods
During the conference in May 2025, four occupied guestrooms with inoperable windows were monitored: two single-occupancy rooms (460 and 387 ft²), one double-occupancy room (387 ft²), and one triple-occupancy room (387 ft²). Two rooms were observed for four nights each and two for two nights each (12 room-nights). A bedside AirGradient ONE Cellular monitor recorded CO₂ (NDIR sensor), fine particulate matter (PM₂.₅; optical sensor), temperature, and relative humidity at three-minute intervals. From 5,476 total observations, 1,707 sleep-period records were identified using occupants’ logged sleeping times. Analyses included room-level descriptive statistics, Kruskal–Wallis tests on nightly summaries, Spearman correlations, and approximate CO₂-based ventilation estimates.
Sleep-period results
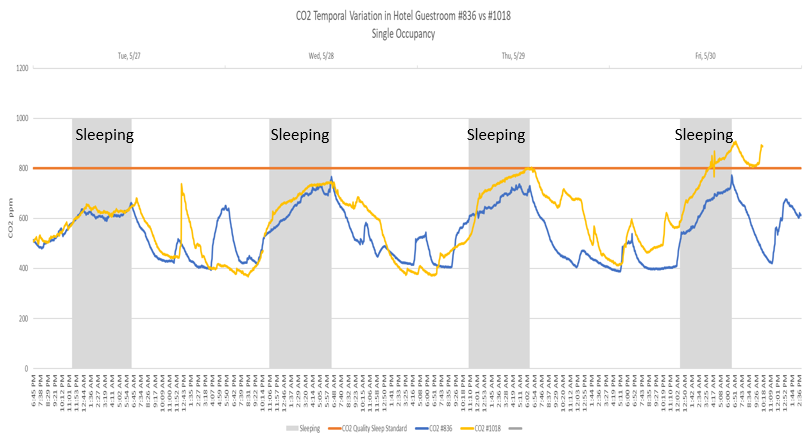
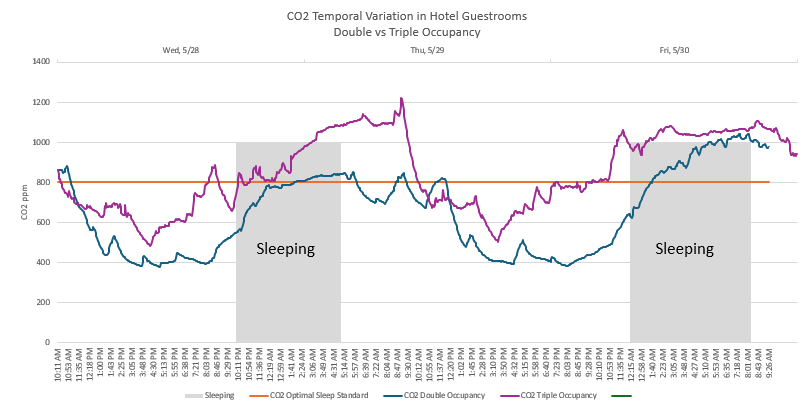
CO₂ accumulation, not PM₂.₅ pollution, was the principal difference among the rooms. The larger single-occupancy room (Corner Room) remained below the preferred 800 ppm benchmark throughout sleep, whereas the smaller single-occupancy room (Standard Room) exceeded it during 11.0% of sleep-period records. The double-occupancy room exceeded 800 ppm during 64.2% of records and the triple-occupancy room during all records. By contrast, sleep-period PM₂.₅ means were only 0.03–0.92 µg/m³ across rooms.
Table 1. Measured sleep-period indoor air quality
| Guestroom / occupancy | Mean CO₂ ± SD (ppm) | Peak CO₂ (ppm) | CO₂ > 800 (% records) | Mean PM₂.₅ (µg/m³) |
|---|---|---|---|---|
| Room 836 · 1 guest 460 ft² | 644.63 ± 53.79 | 772 | 0.0% | 0.06 |
| Room 1018 · 1 guest 387 ft² | 699.98 ± 80.01 | 906 | 11.0% | 0.92 |
| 2 guests · 387 ft² | 841.01 ± 121.07 | 1,044 | 64.2% | 0.03 |
| 3 guests · 387 ft² | 1,061.85 ± 35.53 | 1,141 | 100.0% | 0.04 |
Note. Sleep-period n: Room 836 = 561; Room 1018 = 591; 2 guests = 299; 3 guests = 256. CO₂ is a ventilation proxy.
CO₂ patterns across the stay
Shaded areas indicate sleeping periods. The orange line marks the study’s preferred 800 ppm sleep-period reference, rather than a universal sleep-quality standard. These figures show CO₂ across the full monitoring period; the table summarizes sleep periods only.
Statistical evidence and ventilation estimates
Across 12 room-nights, nightly mean CO₂ differed among rooms (Kruskal–Wallis H = 8.13, p = .043). Dunn–Bonferroni testing identified a significant contrast between Room 836 and the triple-occupancy room (adjusted p = .049). The number of occupants correlated positively with both nightly mean and maximum CO₂ (Spearman ρ = .794, p = .002 for each); correlations with PM₂.₅, temperature, and relative humidity were not significant. Because occupancy also differed by room, these observational associations cannot isolate occupancy effects from room-specific ventilation or configuration.
A steady-state CO₂ mass-balance approximation suggested fresh-air delivery of 19.76 L/s/person for single occupancy (averaged over the two single rooms), 11.88 L/s/person for double occupancy, and 7.79 L/s/person for triple occupancy. Estimates assumed outdoor CO₂ of 420 ppm and sleeping-adult CO₂ generation of 0.005 L/s; they are not direct measurements of mechanical airflow. Average sleeping-period relative humidity ranged from 66.85% to 71.36%, above the optimal 40-60% reference. Brief daytime PM₂.₅ peaks may have coincided with housekeeping or room-entry activities, although sources were not verified.
Implications for hospitality practice
These findings illustrate a consequential distinction between clean air and fresh air: guestrooms may register negligible particulate pollution yet accumulate occupants’ exhaled breath when outdoor-air ventilation is insufficient for the number of sleepers. Existing bedroom research associates higher CO₂, as a ventilation proxy, with less favorable sleep outcomes; the present study raises a concern about sleep-supportive conditions in shared rooms, but does not demonstrate impaired sleep among the participating guests.
Hotels should evaluate overnight ventilation under realistic single, double, and family occupancy, rather than assuming that performance for one guest extends to multiple occupants. Continuous CO₂ trends, combined with outdoor concentrations, occupancy data, and HVAC assessments, can inform ventilation adjustment, maintenance, and room-assignment decisions. Humid destinations also require attention to dehumidification alongside ventilation. By monitoring and responsibly communicating verified IAQ performance, hotel operators can make otherwise invisible infrastructure investments recognizable to guests and potentially differentiate their sleep and wellness offerings. Daytime particle spikes warrant additional assessment of housekeeping practices and staff exposures.
Contribution and limitations
By measuring air quality at the bedside during actual hotel stays, this case study extends perception-based hotel sleep research and demonstrates that sleep-period ventilation indicators can vary substantially within a single five-star property. Generalization is limited by four guestrooms in one hotel, only 12 room-nights, and indirect rather than measured outdoor-air supply. Neither objective nor self-reported sleep quality was assessed; observed CO₂ values must not be interpreted as proof of sleep impairment. Future multi-hotel research should combine overnight IAQ, measured airflow, occupancy, and validated sleep outcomes.
Selected references
Akimoto, M., et al. (2025). New research on bedroom ventilation and sleep quality suggests that building standards should be revisited. Science and Technology for the Built Environment, 31(8), 905–916. https://doi.org/10.1080/23744731.2025.2531317
Lin, X., et al. (2026). Association of bedroom particulate matter, sleep quality and next-day physical performance. Scientific Reports, 16, 7117. https://doi.org/10.1038/s41598-026-37949-2
Mao, Z., Yang, Y., & Wang, M. (2018). Sleepless nights in hotels? Understanding factors that influence hotel sleep quality. International Journal of Hospitality Management, 74, 189–201. https://doi.org/10.1016/j.ijhm.2018.05.002
Robbins, R., Grandner, M., Knowlden, A., & Severt, K. (2021). Examining key hotel attributes for guest sleep and overall satisfaction. Tourism and Hospitality Research, 21(2), 144–155. https://doi.org/10.1177/1467358420961544
Xiong, J., Lan, L., Lian, Z., & de Dear, R. (2020). Associations of bedroom temperature and ventilation with sleep quality. Science and Technology for the Built Environment, 26(9), 1274–1284. https://doi.org/10.1080/23744731.2020.1756664